While working on a Sitecore 8 MVC solution, I encountered an issue where the Experience Editor would suddenly hang or freeze the browser when inserting certain renderings into the layout.
In this blog post I'll go into the details on what caused this behaviour, and how you can resolve such issues.
The Experience Editor that hanged
The first time I saw the error occurred was when I inserted one of my renderings into a layout page, whereas the browser would end up hanging. I noticed that it was most noticeable in Internet Explorer 11, as I did not get the error that much in either Chrome or Firefox. While going over the Sitecore log files, I did not find any clue on what was going on, and the console in the browser did not output anything of use. Although the browser would hang, I was sometimes lucky enough that after a long enough period of time, the browser would come back to life.
Based on that I did a performance troubleshooting diagnostic, meaning that I recorded what was going on when the browser went hanging.
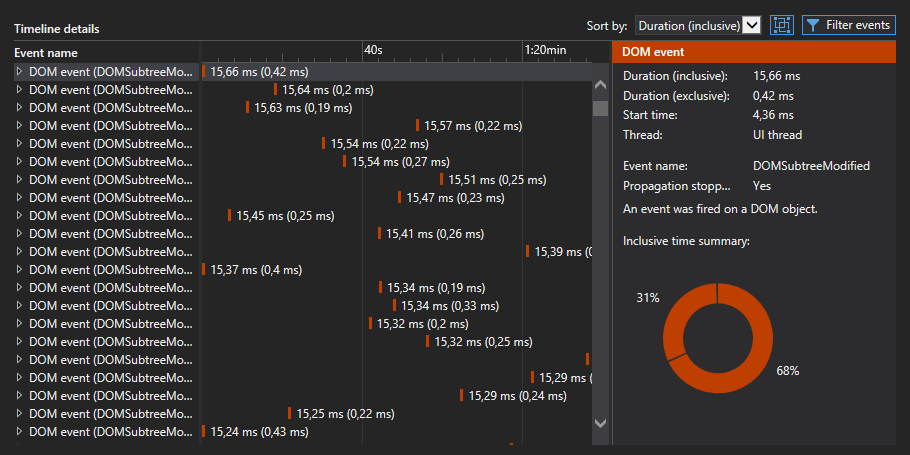
On the basis of the performance diagnostic, one of the things that struck me was that the UI tread was completely flooded, which gave an explanation to why the browser was unresponsive for a long period of time:

Looking a bit closer at each call, I was able to verify that each one of these was related to an event fired by an modified DOM element, and that the same event would occur over and over again:

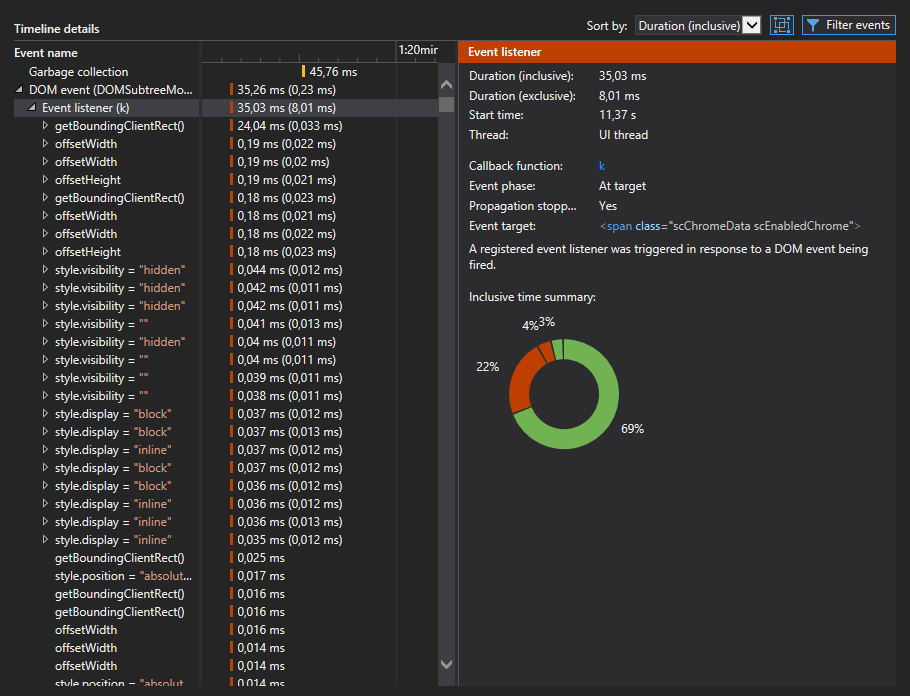
Going more into the details of the call, I found that the event was fired from the chrome (the button menu appearing when you select a rendering in the Experience Editor) DOM element, that would seem to belong to the rendering, which I inserted into the layout:

By simply looking at the calls being made, I quickly discovered that there were a lot of the same function calls being made in each of these, including:
- Getting the offset width and height
- Getting the bounding rectangle of the DOM element
- Setting the display style and visibility
- etc...
With my newly gained knowledge, I was now able to start debugging the JavaScript code that was causing the failure, since I now could see which calls were made, causing the browser to hang.
Going down the rabbit hole
In order to figure out, what was really going on under the hood of the Experience Editor, I had to do a bit of JavaScript debugging. From my extended period of trail and error doing the debugging, I was able to pinpoint a few interesting spots in the different parts of the client-side code used by the Experience Editor, where things might go wrong.

When inserting a new rendering, Sitecore.PageModes.ChromeTypes.Placeholder makes a call to a insertRendering function, which is used when new controls are being inserted. Once the rendering has been inserted, all the chromes in the layout are being reset by calling the function resetChromes() inside the Sitecore.PageModes.ChromeManager. When the call the resetChromes() happens this will loop over each chrome of type Sitecore.PageModes.Chrome, and call its reset() function, whereas this will then reset the position of the chrome. The position is of type Sitecore.PageModes.Position and calling the reset() function will do a few things:
- Reset the current dimensions
- Try to get the new layout root element of the chrome
- Unbind the resize event of the previous layout root element
- Update the element belonging to the position to be the newly found layout root element
- Bind the resize event to the new root element
- Fire a "position updated" event
Afterwards the function bound to the resize event, called onResize(e) inside Sitecore.PageModes.Position, will be triggered.
Once the event has been triggered I noticed that things started to go wrong, since the flow of the code explained in the above starts to repeat it self multiple times, until the browser starts hanging.
I did some more analysis on each of the steps found inside the reset() function of Sitecore.PageModes.Position, and saw that for some of the renderings the layout root element found in step 2 consisted of more then one element. Even more interesting, I was able to confirm that when the code hit the renderings that yielded more then one layout root node, the code started to fail.
The missing layout root node
Based on my troubleshooting and debugging, I now had a lead as one of the renderings might had some issues with regards to their "layout root node". I decided to strip down the page to only a few components, and slowly insert a component one at the time until the page would fail. By doing so, I started to see a pattern in terms of which components failed and which did not.
It turned out that two of the renderings that I had inserted into my page were missing a wrapping <div> element around the other HTML elements in the rendering views, and guess what, this was actually the problem.

I did some more experiments in order to see, how I could make the Experience Editor JavaScript go crazy. From this, I found a few cases which caused the odd behaviour, which boils down to the following list:
- No layout root node: Having only a field renderer (
@Model.RenderField(...)) or model binding (@Model.MyProperty) will hang the Experience Editor. Here you need to wrap the model binding into a<div>layout root node. - Multiple potential layout root nodes: If you have more then one potential layout root node, like
<div>@Model.MyProperty</div> <div>@Model.MyOtherProperty</div>, then your rendering will also hang the Experience Editor. Here you need to wrap the two<div>elements into a single<div>layout root node.
Final words
If you have been working with Sitecore MVC, you will eventually stumble upon some things, where you'll either be thinking "Great feature, nicely done", or "Whoa, what on earth is going on here?!" - for me, this error/feature was definitely the latter.
Based on what I was able to troubleshoot and debug, my best guess is that, since there is no direct layout root element defined for the rendering (the MVC view), which is to be found as part of resetting the position, Sitecore gets confused. As a consequence it goes into an semi-infinite loop, where it tries to calculate position (dimensions and offset) of the chrome for the rendering - which is also something you can see if you keep debugging long enough, whereas the chrome will keep growing in size. Ultimately, this ends up exploding into a gazillion calls, that effectively makes the browser hang.
As always, if you have any additional knowledge on this subject, comments or questions, please let me know in the comments section down below.